
PERFECT EXPOSURE USING THE HISTOGRAM
With the invention of digital cameras came the best tool for achieving perfect exposure in the field: the histogram.
The histogram displays the amount of darks, lights, and neutral tones in an image. By reviewing your histogram after each shot, you can gain a better understanding of how your camera processes the scene, which will let you make adjustments to achieve that perfect exposure.
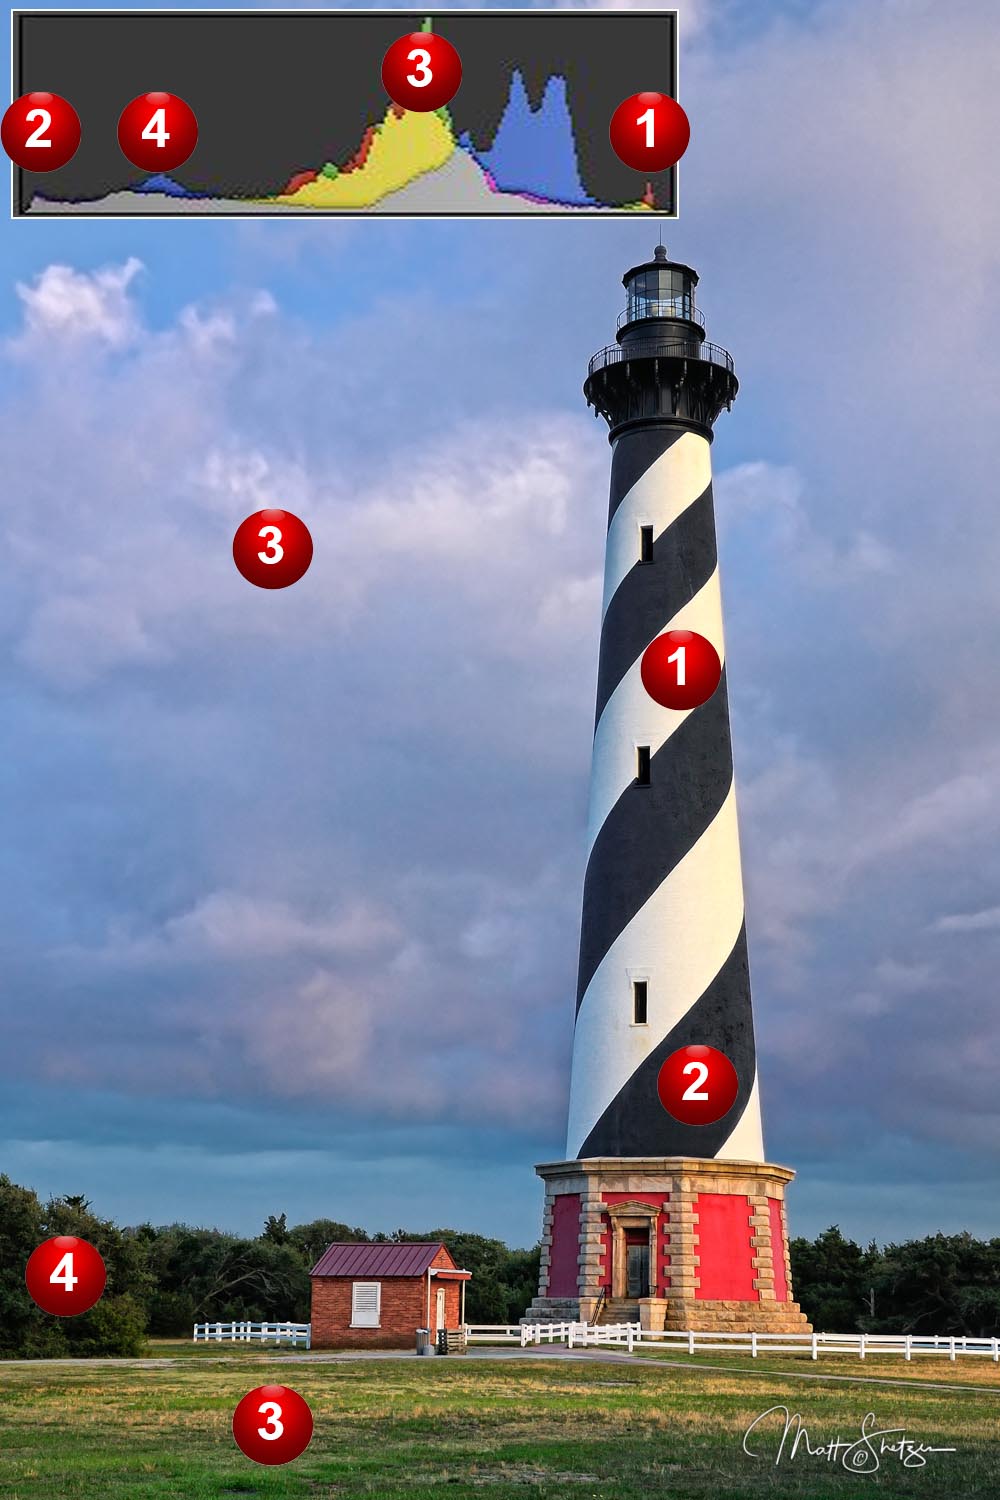
Below, you’ll see a picture I took of a lighthouse, with the histogram added at the top for reference. Match each number on the histogram with the same number on the picture, and see what you notice.
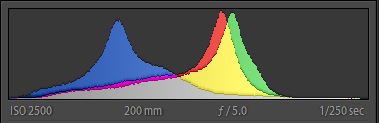
The histogram shows the amount of brightness in the image at each level. The darkest tones are shown on the left, the lightest tones on the right, and neutral tones in the middle.
The higher the line on any portion of the histogram, the more pixels in the image have that brightness level. If most of the activity in the histogram is on the right-hand side, the picture has lighter tone overall. If it’s mostly on the left, the picture has more darks and shadows.
If the mass of pixels is clustered all the way against one side of the histogram (called clipping), that tells you the image is poorly exposed. With pixels pushed up against the left, the image is underexposed, with gloomy shadows swallowing most of the detail. If the pixels are clustered against the right side, the image is overexposed, and you’ve lost detail in the bright parts of the image.
Got all that? Once you’re comfortable with basic histogram concepts, let’s apply them to the lighthouse picture shown above. Look once more at each number in order.
 This marks the location of the brightest whites in the image, the white stripes on the lighthouse. Looking at the histogram, we can see that the brightest whites are close to the right side of the graph but not touching it. This means the image is properly exposed, since even at the brightest colors, no detail has been lost.
 Shows the darkest blacks in the image, the black stripes on the lighthouse. The “2” on the histogram shows us that the spike of black pixels is close to, but not touching, the left side of the graph. Since this image was taken with the proper light level, no detail is lost in the dark spots. If I had overexposed this picture (let too much light into the lens), the black spike would be closer to the middle of the histogram, reflecting the whole histogram shifting toward the bright end.
 This marks an area of neutral-light tones, where most of the colors in this image lie. Examples include the grass, the sky, and the lighthouse’s brick walls. In the histogram, these tones are closer to the light end, but not as close as the pure white surfaces.
 This shows the neutral-dark areas of tone, which are mostly trees. They’re closer to the dark end, but not as close as the blacks.
By reviewing your histogram after each shot, and identifying where the spikes are, you can make adjustments to your exposure levels to create a superior image.
If the spikes are all clustered against the left-hand side of your histogram, use a slower shutter speed, a wider aperture, higher ISO (positive exposure compensation needed), depending on your subject and desired depth of field. If your pixels are all on the right, use a lower ISO, faster shutter speed, and/or a narrower aperture (negative exposure compensation needed).
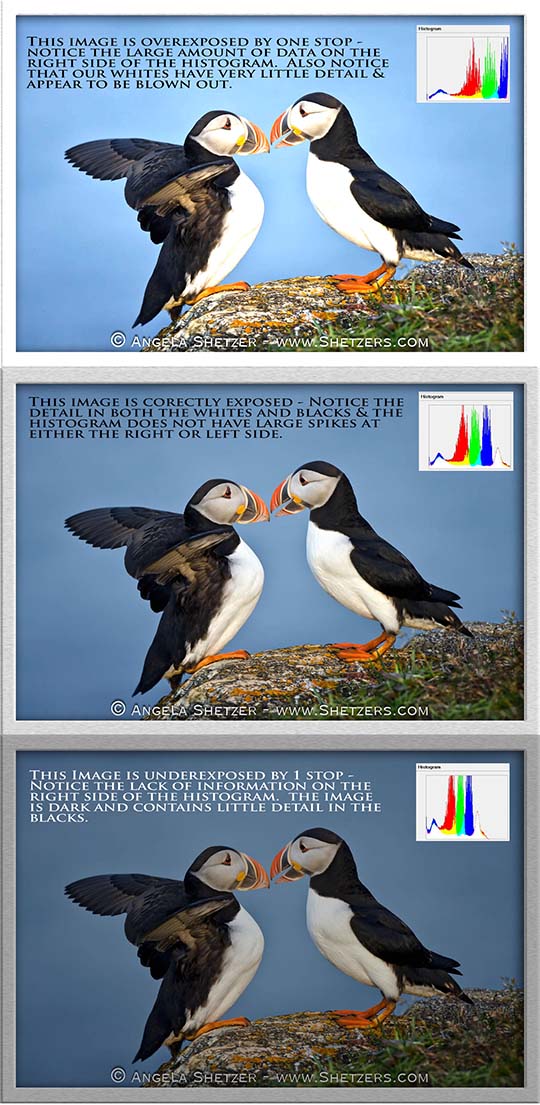
Below, I’ve shared the same image three times: overexposed, underexposed, and correctly exposed. To start, see if you can figure out which is which by looking only at the histogram. Then check the text on the images to see if you were right.
Quick Tip
Look at where data is placed within your histogram. The spikes should reflect the brightness\darkness of the image. If the image is light toned, the large spikes should be on the right side without hitting the right wall. If the image is dark toned, the large spike should be on the left side without hitting the left wall. If the image is middle tone, the large spike should be in the center. If the histogram spikes do not reflect the tone of the image, the image is not exposed properly.
ASSIGNMENTS
Now it’s time to experiment so you can get comfortable with your camera’s histogram. First, you will need to turn it on. Grab that manual, and look up how to turn on your RGB histogram.
- Take a photo that contains a pure white surface. This could be a wall, an article of clothing, or a piece of paper, but man-made objects are best — natural whites like clouds and flowers are too variable.
Use one of your auto modes, like Aperture Priority or Shutter Priority. After each photo, review the histogram. You’re looking for a spike on the right side of the histogram that doesn’t hit the wall (hitting the wall is called clipping). If it is not there, add “exposure compensation” using the +/- button (see your manual). - Take a photo of something completely black. Continue adjusting the exposure downward until your histogram’s spike is near the left side, but not touching it. Take as many pictures as you need!
- Grab your camera and get outside. Find scenes with an abundance of natural colors, and adjust exposure until your histogram’s biggest spike is located in the middle of the graph.
- Practice on multiple different subjects, and keep working with your exposure until you get a feel for capturing just the right light levels. You’ll get the hang of it, and it will become natural after a while. Practice makes perfect!
Add positive compensation, and take another shot of the same subject. Repeat until your histogram’s big spike is on the right. If you overshoot, reduce the exposure compensation and try again. Once you get the spike near but not at the wall, every other tone in the scene will be exposed correctly.
Quick Tip
Reset your exposure compensation to zero when you’re done. This will help when you next pick up the camera.